Country Information


Finland
Two thirds of Finland’s land area is covered by forest. The country is almost entirely part of the Eurasian boreal forest zone.
Finland is an important supplier of forest products to global markets, as the country’s share of the global export trade of forest products is about 7 percent. Obviously the forest sectors is of importance to the country’s economy The Finnish forest sector has certain assets. Growing conditions are ideal for conifers, tree species are valuable and easily workable, and harvesting conditions and infrastructure are good. Access to major European market is important, as the Finnish forest sector is highly export-oriented.
For the Finnish, forests also present an ecological and cultural resource. Outdoor activities like berry-picking and mushrooming are very popular and berries and mushrooms are also commercially used and exported. In Lapland reindeers herd in forests.
Forest ownership is widespread as approximately 739 000 Finns own some forest.
LAND COVER
| (1000 ha) | % | |
| Forest | 22 157 | 66 |
| Other Wooded Land | 1 112 | 3 |
| Other land | 7 140 | 21 |
| Inland Water Bodies | 3 433 | 10 |
| Total | 33 842 | 100 |
FOREST RESOURCES
| Protected Forest Area, classified under the MCPFE protection class 1.1-1.3 (1000ha) | 2 272 |
| Forest Available for Wood Supply (1000ha) | 19 869 |
Growing Stock on Forest (million m3 over bark) | 2 207 |
| Net Annual Increment on Forest (FAWS) (1000m3 over bark) | 91 038 |
Dominant Tree Species (2005)
| Scientific Name | Common Name | Growing stock in forest (mill. m3) |
| Pinus sylvestris | Scots Pine | 1 085 |
| Picea abies | Norway spruce | 668 |
| Betula pubescens | Downy birch | 264 |
| Betula pendula | Silver birch | 96 |
| Populus tremula | European aspen | 33 |
FOREST SECTOR
Quantity Averages 2007-2011
| Production | Exports | Imports | |
| Roundwood (1000m3) | 50 131 | 629 | 8 718 |
| Industrial Roundwood (1000m3) | 45 115 | 610 | 8 413 |
| Wood Fuel (1000 m3) | 5 016 | 19 | 305 |
| Sawnwood (1000m3) | 9 931 | 6 027 | 547 |
| Wood based panels (1000m3) | 1 506 | 1 142 | 393 |
| Wood Pulp (1000 tons) | 10 833 | 2 174 | 418 |
| Paper and Paperboard (1000 tons) | 12 230 | 11 175 | 464 |
Forest Products Trade Value
Averages 2007-2011 (1000 $)
| Exports | Imports |
| 13 887 254 | 2 035 625 |
Employment in the Forest Sector
| /1000 persons | % of total labor force | |
| Persons Employed in the Forest Sector (2006) | 90 | 3,6 |
| USD mill. | % of GDP | |
| Value added by the forest sector (2006) | 10 329 | 5,7 |
FOREST OWNERSHIP
| Forest Area (1000 ha) | % |
| Public | 6 988 | 32 |
| Private | 15 168 | 68 |
| Total | 22 157 | 100 |
MAIN FOREST SECTOR ACTORS
Research organizations, institutes, and universities:
- The Finnish Forest Research Institute (Metla)
- The University of Eastern Finland, Faculty of Science and Forestry
- University of Helsinki, Faculty of Agriculture and Forestry
- The European Forest Institute
- Metsäteho
Forest authorities and organizations:
- Ministry of Agriculture and Forestry
- Metsähallitus
- Finnish Forest Industries Federation
- Finnish Forest Association
EUROFOREST Portal
Finland - List of links to resources concerning forests and the forest sector
*Terms and definitions for these categories can be found at http://www.fao.org/docrep/013/i1757e/i1757e13.pdf
Denmark
Denmark is located in the nemoral forest zone and was originally almost completely covered by forest. Due to human activities, the forest cover was down to two per cent around 1800, and has by planting gradually increased to the present 13.6 per cent. Therefore there is only little natural forest left in Denmark, and large parts of the forests are quite uniform and often with limited value for biodiversity protection and recreational purposes. Still, 9 out of 10 adult Danes visit the forest at least once a year. The economic importance of the Danish forests is declining, while other aspects and ecological and social benefits of the forests are of increasing importance to the Danish society.
In 1989 the Danish Parliament decided that the forest-covered area should be doubled by year 2100 to approximately 25 per cent, and in 2002 the Danish National Forest Programme introduced the concept of Near-to-nature forest management in the state-owned forests. 72 per cent of the Danish forests are privately owned, 18 per cent are state forests, and other public institutions own 5 per cent.
In addition to recreation and biodiversity protection Danish forest policy also focuses on international responsibilities like climate change, sustainable forest management and biomass production. The yearly harvest from the Danish forests is around 2.5 million m3, half of which is for different kinds of energy wood.
The total number of FSC or PEFC certified forest in Denmark is 449.039 ha (77 % of the forest land).
LAND COVER
| (1000 ha) | % | |
| Forest | 544 | 13 |
| Other Wooded Land | 47 | 1 |
| Other land | 3 652 | 85 |
| Inland Water Bodies | 67 | 1 |
| Total | 4 310 | 100 |
FOREST RESOURCES
Protected Forest Area, classified under the MCPFE protection class 1.1-1.3 (1000ha) | 92 |
| Forest Available for Wood Supply (1000ha) | 581 |
| Growing Stock on Forest (million m3 over bark) | 113 |
| Net Annual Increment on Forest (FAWS) (1000m3 over bark) | 5 796 |
Dominant Tree Species 2005
| Scientific Name | Common Name | Growing stock in forest (mill.m3) |
| Fagus sylvatica | Beech | 26 |
| Picea abies | Norway spruce | 22 |
| Quercus robur | Oak | 10 |
| Pinus spp. | Pine | 7 |
| Picea sitchensis | Sitka spruce | 7 |
FOREST SECTOR
Quantity Averages 2005-2009
| Production | Exports | Imports |
Roundwood (1000m3) | 2 697 | 832 | 1 206 |
Industrial Roundwood (1000m3) | 1 545 | 800 | 962 |
Wood Fuel (1000m3) | 1 152 | 31 | 243 |
Sawnwood (1000m3) | 307 | 281 | 2 046 |
Wood based panels (1000m3) | 450 | 341 | 2 455 |
Wood Pulp (1000 tons) | 2 | 16 | 7 |
Paper and Paperboard (1000 tons) | 424 | 266 | 1 181 |
Forest Products Trade Value
Averages 2007-2011 (1000$)
| Exports | Imports |
| 630 618 | 2 398 254 |
Employment in the Forest Sector
| /1000 persons | % of total labor force | |
Persons Employed in the Forest Sector (2006) | 25 | 0,9 |
Source: Lebydys, A. FAO 2008. Contribution of the forestry sector to national economies, 1990-2006. Forest Finance Working Paper FSFM/ACC/08. FAO
| USD mill. | % of GDP | |
| Value added by the forest sector (2006) | 1 805 | 0,8 |
Source: Lebydys, A. FAO 2008. Contribution of the forestry sector to national economies, 1990-2006. Forest Finance Working Paper FSFM/ACC/08. FAO
FOREST OWNERSHIP
| Forest Area (1000 ha) | % | |
| Public | 163 | 30 |
| Private | 374 | 69 |
| Other | 7 | 1 |
| Total | 544 | 100 |
Source: UN FAO 2010 Forest Resource Assessment *
MAIN ACTORS IN THE FOREST SECTOR
Research organizations, institutes, and universities:
- Department of Geosciences and Natural Resource Management, University of Copenhagen
- The European Forest Institute, North European Regional Office (located in Denmark 2010-2013)
Forest authorities and organizations:
EUROFOREST Portal
Denmark - List of links to resources concerning forests and the forest sector
*Terms and definitions for these categories can be found at http://www.fao.org/docrep/013/i1757e/i1757e13.pdf
Sweden
LAND COVER
| (1000 ha) | % | |
| Forest | 28 203 | 62 |
| Other Wooded Land | 3 044 | 7 |
| Other land | 9 786 | 22 |
| Inland Water Bodies | 3 996 | 9 |
| Total | 45 029 | 100 |
FOREST RESOURCES
Protected Forest Area, classified under the MCPFE protection class 1.1-1.3 (1000ha) | 1 280 |
| Forest Available for Wood Supply (1000ha) | 20 554 |
| Growing Stock on Forest (million m3 over bark) | 3 243 |
| Net Annual Increment on Forest (FAWS) (1000 m3 over bark) | 96 486 |
Dominant Tree Species 2005
| Scientific Name | Common Name | Growing stock in forest (mill. m3) |
| Picea abies | Norway spruce | 1 238 |
| Pinus sylvestris | Scots pine | 1 296 |
| Betula pubescens | Downy birch | 99 |
| Populus tremula | European aspen | 56 |
| Quercuz robur | English oak | 36 |
| Almus glutinosa | Black alder | 36 |
FOREST SECTOR
Quantity Averages 2007-2011
| Production | Exports | Imports | |
| Roundwood (1000 m3) | 71 681 | 1 939 | 6 783 |
| Industrial Roundwood (1000 m3) | 65 781 | 1 879 | 6 364 |
| Wood Fuel (1000 m3) | 5 900 | 60 | 419 |
| Sawnwood (1000 m3) | 17 218 | 11 735 | 394 |
| Wood based panels (1000 m3) | 772 | 270 | 1 101 |
| Wood Pulp (1000 tons) | 12 005 | 3 363 | 433 |
| Paper and Paperboard (1000 tons) | 11 363 | 10 331 | 935 |
Forest Products Trade Value
Averages 2007-2011 (1000 $)
| Exports | Imports |
| 16 144 825 | 2 924 862 |
Employment in the Forest Sector
| /1000 persons | % of total labor force | |
| Persons Employed in the Forest Sector (2006) | 95 | 2 |
| USD mill. | % of GDP | |
| Value added by the forest sector (2006) | 12 753 | 3,8 |
Source: Lebydys, A. FAO 2008. Contribution of the forestry sector to national economies, 1990-2006. Forest Finance Working Paper FSFM/ACC/08. FAO
FOREST OWNERSHIP
| Forest Area (1000 ha) | % | |
| Public | 6 629 | 24 |
| Private | 21 573 | 76 |
| Total | 28 202 | 100 |
Source: UN FAO 2010 Forest Resource Assessment*
MAIN ACTORS IN THE FOREST SECTOR
Research organizations, institutes, and universities:
- The Swedish University of Agricultural Sciences, Faculty of Forestry
- Linnaeus University
- Mid Sweden University
- Skogforsk
- Nordic Forest Research (SNS) (located in Sweden 2014-2017)
Forest authorities and organizations:
EUROFOREST Portal
Sweden - List of links to resources concerning forests and the forest sector
*Terms and definitions for these categories can be found at http://www.fao.org/docrep/013/i1757e/i1757e13.pdf
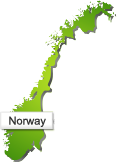
Norway
39 percent of Norway’s land area is covered by wooded land. Because of all the fiords and islands from south to north, the country has a very long coastline, in fact the longest in the world after Canada, and 44 % of the land area is mountain terrain (above timber line). Only 10 percent is cultivable area.
Conifers are the most important trees for forest economy. The forest area is covered with one third Norway spruce, one third Scots pine and one third broadleaved species.
More than three fourth of the forest area is owned by private individual ownership. There are 43 800 forest owners in Norway.
There is year-round free access for the general public to non-cultivated land in Norway. The public has a right to walk anywhere in forests and pick berries and mushrooms for their own consumption. Hunting and fishing are important activities for many Norwegians and landowners hold exclusive rights to hunting and fishing on their land.
LAND COVER
| (1000 ha) | % | |
| Forest | 10 065 | 31 |
| Other Wooded Land | 2 703 | 8 |
| Other land | 17 659 | 55 |
| Inland Water Bodies | 1 953 | 6 |
| Total | 32 380 | 100 |
FOREST RESOURCES
| Protected Forest Area, classified under the MCPFE protection class 1.1-1.3 (1000ha) | 183 |
| Forest Available for Wood Supply (1000ha) | 6 419 |
| Growing Stock on Forest (million m3 over bark) | 997 |
Net Annual Increment on Forest (FAWS) (1000 m3 over bark) | 21 878 |
Dominant Tree Species 2005
| Scientific Name | Common Name | Growing stock in forest (mill. m3) |
| Picea abies | Norway spruce | 393 |
| Pinus sylvestris | Scots pine | 288 |
| Betula pubescens | Downy birch | 133 |
| Populus tremula | European aspen | 16 |
| Alnus incana | Grey alder | 15 |
FOREST SECTOR
Quantity Averages 2007-2011
| Production | Exports | Imports | |
| Roundwood (1000 m3) | 10 081 | 914 | 1 763 |
| Industrial Roundwood (1000 m3) | 7 948 | 904 | 1 584 |
| Wood Fuel (1000 m3) | 2 133 | 11 | 179 |
| Sawnwood (1000 m3) | 2 174 | 446 | 994 |
| Wood based panels (1000 m3) | 531 | 228 | 347 |
| Wood Pulp (1000 tons) | 2 076 | 597 | 49 |
| Paper and Paperboard (1000 tons) | 1 735 | 1 486 | 454 |
Forest Products Trade Value
Averages 2007-2011 (1000 $)
| Exports | Imports |
| 1 919 270 | 1 463 184 |
Employment in the Forest Sector
| /1000 persons | % of total labor force | |
| Persons Employed in the Forest Sector (2006) | 26 | 1,1 |
| USD mill. | % of GDP | |
| Value added by the forest sector (2006) | 2 234 | 0,8 |
Source: Lebydys, A. FAO 2008. Contribution of the forestry sector to national economies, 1990-2006. Forest Finance Working Paper FSFM/ACC/08. FAO
FOREST OWNERSHIP
| Forest Area (1000 ha) | % | |
| Public | 1 362 | 14 |
| Private | 8 321 | 86 |
| Other | 0 | 0 |
| Total | 9 683 | 100 |
MAIN ACTORS IN THE FOREST SECTOR
Research organizations, institutes, and universities:
- The Norwegian University of Life Sciences, Department of Ecology and Natural Resource Management
- The Norwegian Forest and Landscape Institute
- The Norwegian Institute of Wood Technology (NTI)
Forest authorities and organizations:
- Norwegian Ministry of Agriculture and Food
- Norwegian Forestry Group
- Nordic Family Forestry
- Norwegian Forestry Society
EUROFOREST Portal
Norway - List of links to resources concerning forests and the forest sector
*Terms and definitions for these categories can be found at http://www.fao.org/docrep/013/i1757e/i1757e13.pdf
Iceland
LAND COVER
| (1000 ha) | % | |
| Forest | 29,9 | >1 |
| Other Wooded Land | 86,1 | >1 |
| Other land | 9909 | 97 |
| Inland Water Bodies | 275 | >1 |
| Total | 10 300 | 100 |
FOREST RESOURCES
Protected Forest Area, classified under the MCPFE protection class 1.1-1.3 (1000ha) | 0 |
| Forest Available for Wood Supply (1000ha) | 29 |
| Growing Stock on Forest (million m3 over bark) | 0,45 |
| Net Annual Increment on Forest (FAWS) (1000m3 over bark) | n.a |
Dominant Tree Species 2005
| Scientific Name | Common Name | Growing stock in forest (mill. m3) |
| Betula pubescens | Downy birch | 0,198 |
| Larix sibirica | Siberian larch | 0,054 |
| Pinus contorta | Lodgepole pine | 0,035 |
| Picea sitchensis | Sitka spruce | 0,027 |
FOREST SECTOR
Quantity Averages 2007-2011
| Production | Exports | Imports | |
| Roundwood (1000m3) | 0 | 0 | 1 |
| Industrial Roundwood (1000m3) | 0 | 0 | 1 |
| Wood Fuel (1000m3) | 0 | 0 | 0,08 |
| Sawnwood (1000m3) | 0 | 0,755 | 84,87 |
| Wood based panels (1000m3) | 0 | 0,035 | 19,4 |
| Wood Pulp (1000 tons) | 0 | 0 | 5 |
| Paper and Paperboard (1000 tons) | 0 | 0,114 | 32 |
Forest Products Trade Value
Averages 2007-2011 (1000 $)
| Exports | Imports |
| 2 092 | 78 916 |
FOREST OWNERSHIP
| Forest Area (1000 ha) | % | |
| Public | 8 | 30 |
| Private | 18 | 70 |
| Total | 25 | 100 |
MAIN ACTORS IN THE FOREST SECTOR
Research organizations, institutes, and universities:
Forest authorities and organizations:
EUROFOREST Portal
Iceland - List of links to resources concerning forests and the forest sector
*Terms and definitions for these categories can be found at http://www.fao.org/docrep/013/i1757e/i1757e13.pdf
Poland
| (1000 ha) | % |
| Forest | 9 337 | 30 |
| Other Wooded Land | 0 | 0 |
| Other land | 21 296 | 68 |
| Inland Water Bodies | 636 | 2 |
| Total | 31 269 | 100 |
FOREST RESOURCES
Protected Forest Area, classified under the MCPFE protection class 1.1-1.3 (1000ha) | 299 |
| Forest Available for Wood Supply (1000ha) | 8 532 |
| Growing Stock on Forest (million m3 over bark) | 2 304 |
| Net Annual Increment on Forest (FAWS) (1000 m3 over bark) | 67 595 |
Dominant Tree Species 2005
| Scientific Name | Common Name | Growing stock in forest (mill. m3) |
Pinus silvestris, Pinus spp.Larix decidua | Scots Pine | 1 302 |
| Picea abies | Norway Spruce | 127 |
| Quercus spp. , Fraxinus excelsior, Acer platanoides, Acer pseudoplatanus, Ulmus | Oak, Ash, Maple, Sycamore Maple, Elm | 120 |
| Fagus sylvatica | European Beech | 105 |
| Betula spp., Robinia pseudoacacia | Birch, Robina | 88 |
| Alnus spp. | Alder | 88 |
FOREST SECTOR
Quantity Averages 2007-2011
| Production | Exports | Imports | |
| Roundwood (1000 m3) | 35 497 | 1 110 | 2 325 |
| Industrial Roundwood (1000 m3) | 31 390 | 1 013 | 2 307 |
| Wood Fuel (1000 m3) | 4 107 | 97 | 18 |
| Sawnwood (1000 m3) | 4 154 | 501 | 797 |
| Wood based panels (1000 m3) | 8 205 | 2 142 | 1 679 |
| Wood Pulp (1000 tons) | 1 062 | 26 | 637 |
| Paper and Paperboard (1000 tons) | 3 356 | 1 708 | 2 916 |
Forest Products Trade Value
| Exports | Imports |
| 3 010 881 | 4 311 942 |
Employment in the Forest Sector
| /1000 persons | % of total labor force | |
| Persons Employed in the Forest Sector (2006) | 229 | 1,11 |
| USD mill. | % of GDP | |
| Value added by the forest sector (2006) | 4 353 | 1,5 |
FOREST OWNERSHIP
| Forest Area (1000 ha) | % | |
| Public | 7 610 | 83 |
| Private | 1 590 | 17 |
| Other | 0 | 0 |
| Total | 9 200 | 100 |
MAIN ACTORS IN THE FOREST SECTOR
Research organizations, institutes, and universities:
Forest authorities and organizations:
EUROFOREST Portal
Poland - List of links to resources concerning forests and the forest sector
*Terms and definitions for these categories can be found at http://www.fao.org/docrep/013/i1757e/i1757e13.pdf
Estonia
LAND COVER
| (1000 ha) | % | |
| Forest | 2 217 | 49 |
| Other Wooded Land | 133 | 3 |
| Other land | 1 889 | 42 |
| Inland Water Bodies | 284 | 6 |
| Total | 4 523 | 100 |
FOREST RESOURCES
MCPFE protection class 1.1-1.3 (1000ha) | 230 |
Forest Available for Wood Supply (1000ha) | 2 013 |
| Growing Stock on Forest (million m3 over bark) | 441 |
Net Annual Increment on Forest (FAWS) (1000 m3 over bark) | 11 201 |
Dominant Tree Species 2005
| Scientific Name | Common Name | Growing stock in forest (mill. m3) |
| Pinus sylvestris | Scots Pine | 138.4 |
| Picea abies | Norway Spruce | 108.2 |
| Betula pendula, Betula pubescens | Common silver birch, Downy birch | 100.3 |
| Populus tremula | European Aspen | 34.9 |
| Alnus incana | White Alder | 32.6 |
| Alnus glutinosa | European Black Alder | 21.8 |
FOREST SECTOR
Quantity Averages 2007-2011
| Production | Exports | Imports | |
| Roundwood (1000 m3) | 5 886 | 1 925 | 594 |
| Industrial Roundwood (1000 m3) | 4 406 | 1 782 | 577 |
| Wood Fuel (1000 m3) | 1 480 | 143 | 17 |
| Sawnwood (1000 m3) | 1 480 | 673 | 644 |
| Wood based panels (1000 m3) | 355 | 275 | 190 |
| Wood Pulp (1000 tons) | 206 | 132 | 0 |
| Paper and Paperboard (1000 tons) | 72 | 96 | 138 |
Forest Products Trade Value
Averages 2007-2011 (1000 $)
| Exports | Imports |
| 780 070 | 460 569 |
Employment in the Forest Sector
/1000 persons | % of total labor force | |
| Persons Employed in the Forest Sector (2006) | 28 | 3,6 |
| USD mill. | % of GDP | |
| Value added by the forest sector (2006) | 536 | 3,7 |
FOREST OWNERSHIP
| Forest Area (1000 ha) | % | |
| Public | 894 | 40 |
| Private | 978 | 43 |
| Other | 380 | 17 |
| Total | 2 252 | 100 |
MAIN ACTORS IN THE FOREST SECTOR
Research organizations, institutes, and universities:
Forest authorities and organizations:
- Estonian Forest and Wood Industries Association
- Estonian Ministry of the Environment
- Estonian Private Forest Center (PFC)
EUROFOREST Portal
Estonia - List of links to resources concerning forests and the forest sector
*Terms and definitions for these categories can be found at http://www.fao.org/docrep/013/i1757e/i1757e13.pdf
Latvia
LAND COVER
| (1000 ha) | % | |
| Forest | 3 354 | 52 |
| Other Wooded Land | 113 | 2 |
| Other land | 2 762 | 43 |
| Inland Water Bodies | 230 | 3 |
| Total | 6 459 | 100 |
FOREST RESOURCES
Protected Forest Area, classified under the MCPFE protection class 1.1-1.3 (1000ha) | 336 |
| Forest Available for Wood Supply (1000ha) | 3 138 |
| Growing Stock on Forest (million m3 over bark) | 633 |
| Net Annual Increment on Forest (FAWS) (1000 m3 over bark) | 16 500 |
Dominant Tree Species 2005
| Scientific Name | Common Name | Growing stock in forest (mill. m3) |
| Pinus sylvestris | Scots Pine | 245 |
| Betula | Silver birch | 158 |
| Picea abies | Norway spruce | 87 |
| Alnus incana | Grey alder | 31 |
| Poplus tremula | Aspen | 24 |
FOREST SECTOR
| Quantity Averages 2007-2011 | ||||
| Production | Exports | Imports | ||
| Roundwood (1000m3) | 11 358 | 4 421 | 656 | |
| Industrial Roundwood (1000m3) | 9 986 | 3 589 | 650 | |
| Wood Fuel (1000m3) | 1 372 | 832 | 5 | |
| Sawnwood (1000 m3) | 3 021 | 1 934 | 265 | |
| Wood based panels (1000 m3) | 719 | 675 | 154 | |
| Wood Pulp (1000 tons) | 0 | 0,04 | 0,1 | |
| Paper and Paperboard(1000 tons) | 55 | 34 | 145 | |
Forest Products Trade Value
Averages 2007-2011 (1000$)
| Exports | Imports |
| 1 329 891 | 338 939 |
Employment in the Forest Sector
| /1000 persons | % of total labor force | |
| Persons Employed in the Forest Sector (2006) | 65 | 5 |
| USD mill. | of GDP | |
| Value added by the forest sector (2006) | 610 | 3,4 |
Source: Lebydys, A. FAO 2008. Contribution of the forestry sector to national economies, 1990-2006. Forest Finance Working Paper FSFM/ACC/08. FAO
FOREST OWNERSHIP
| Forest Area (1000 ha) | % | |
| Public | 1 781 | 54 |
| Private | 1 513 | <45 |
| Other | 3 | >1 |
| Total | 3 297 | 100 |
MAIN ACTORS IN THE FOREST SECTOR:
- The Forest Faculty of the Latvian University of Agriculture
- The Latvian State Forestry Research Institute, SILAVA
EUROFOREST Portal
Latvia - List of links to resources concerning forests and the forest sector
*Terms and definitions for these categories can be found at http://www.fao.org/docrep/013/i1757e/i1757e13.pdf
Lithuania
LAND COVER
| (1000 ha) | % |
Forest | 2 160 | 33 |
Other Wooded Land | 80 | 1 |
Other land | 4 028 | 62 |
Inland Water Bodies | 262 | 4 |
Total | 6 530 | 100 |
FOREST RESOURCES
Protected Forest Area, classified under the MCPFE protection class 1.1-1.3 (1000ha) | 197 |
Forest Available for Wood Supply (1000ha) | 1 875 |
Growing Stock on Forest ( million m3 over bark) | 479 |
Net Annual Increment on Forest (FAWS) (1000m3 over bark) | 10 750 |
Dominant Tree Species 2005
Scientific Name | Common Name | Growing stock in forest (mill. m3) |
Pinus sylvestris L. | Pine | 168 |
Picea abies (L.) H. Karst | Spruce | 95 |
Betula pubescens Ehrh. | Birch | 78 |
Alnus glutinosa (L.) Gaertn | Black Alder | 37 |
Populus tremula L | Aspen | 30 |
Alnus incana (L.) Moench | Grey Alder | 22 |
FOREST SECTOR
Quantity Averages 2007-2011
| Production | Exports | Import |
Roundwood (1000m3) | 6 270 | 1 432 | 288 |
Industrial Roundwood (1000m3) | 4 656 | 1 338 | 234 |
Wood Fuel (1000m3) | 1 614 | 94 | 53 |
Sawnwood (1000m3) | 1 206 | 534 | 329 |
Wood based panels (1000m3) | 663 | 239 | 463 |
Wood Pulp (1000 tons) | 0 | 10 | 23 |
Paper and Paperboard (1000 tons) | 124
| 108
| 184 |
Forest Products Trade Value
Averages 2007-2011 (1000 $)
Exports | Imports |
488 322 | 550 929 |
Employment in the Forest Sector
| /1000 persons | % of total labor force |
Persons Employed in the Forest Sector (2006) | 35 | 1,8 |
| USD mill. | % of GDP |
Value added by the forest sector (2006) | 641 | 2,4 |
FOREST OWNERSHIP
| Forest Area (1000 ha) | % |
Public | 1 404 | 66 |
Private | 717 | 33 |
Total | 2 121 | 100 |
MAIN ACTORS IN THE FOREST SECTOR
Research organizations, institutes, and universities:
Forest authorities and organizations:
EUROFOREST Portal
Lithuania - List of links to resources concerning forests and the forest sector
*Terms and definitions for these categories can be found at http://www.fao.org/docrep/013/i1757e/i1757e13.pdf

")